Type : Function, Name : SMI
input:
length1(NumericSimple),
length2(NumericSimple),
length3(NumericSimple);
var:
HH(0),
LL(0);
HH = Highest(H,length1);
LL = Lowest (L,length1);
SMI = 100 * (XAverage(XAverage(C-(0.5*(HH+LL)),length2),length3) /
(0.5 * XAverage(XAverage(HH-LL,length2),length3)));
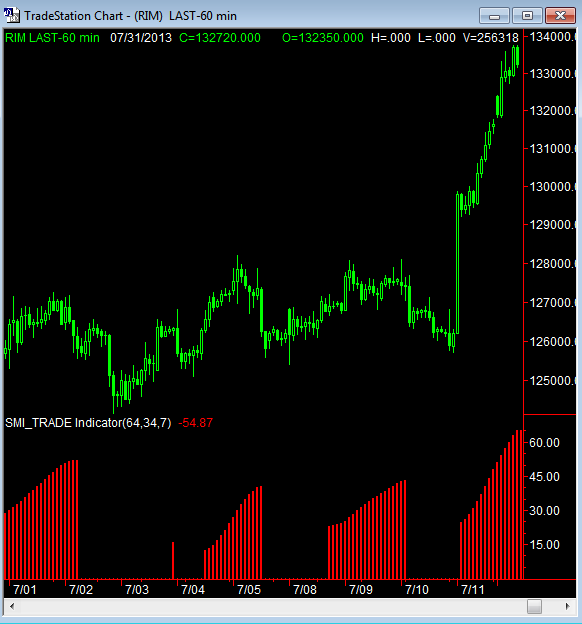
Type : Indicator, Name : SMI_TRADE Indicator
Inputs:
length1(64),
length2(34),
length3(7);
Value1=SMI(length1,length2,length3);
If Value1 — Value1[1] > 0 and Value1 > 0 then
Value2=Value1 {Vaulue2 is portion of SMI that positive and rising}
else
Value2=0;
If Value1-Value1[1] < 0 and Value1 < 0 then
Value3=Value1 {value3 is portion of SMI that is negative and falling}
else
Value3=0;
Value4=Value2+Value3;
Plot1(Value4,»SMI_Trade»);