Function Name: NewMarketParadigm, Output: Numeric
Input: Price(NumericSeries),Length(NumericSimple),StdDevUp (NumericSimple),StdDevDn(NumericSimple);
value1 = BollingerBand(Price,Length,StdDevUp);
value2 = BollingerBand(Price,Length,StdDevDn);
Condition1 = value1 < value1[1] and value2 > value2[1]; {Contraction}{Built as conditions for later revision —WD}
Condition2 = value1 > value1[1] and value2 < value2[1]; {Expansion}
Condition3 = Condition1 = False and Condition2 = False; {Transition}
IF Condition1 then NewMarketParadigm = 1; {Contraction}
IF Condition2 then NewMarketParadigm = 2; {Expansion}
IF Condition3 then NewMarketParadigm = 3; {Transition}
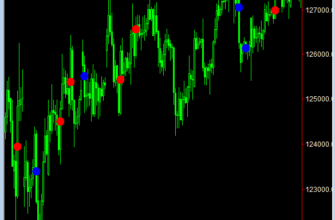
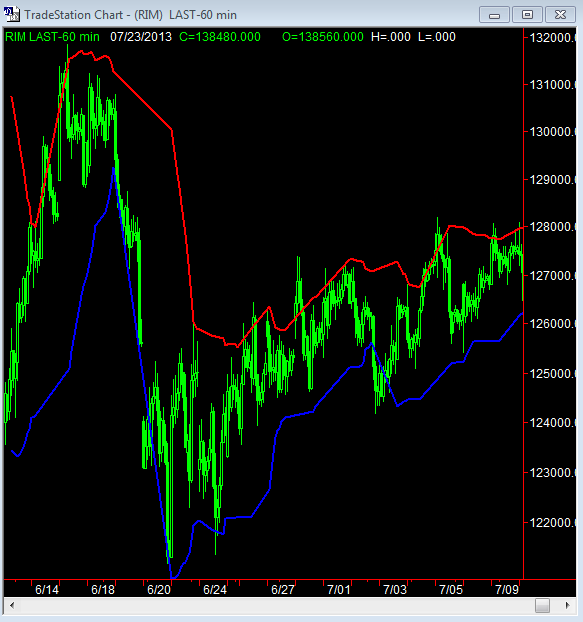
Type: Indicator, Name: NewMarketParadigm C, Style: BLUE
Input: Price(close),Length(28),StdDevUp(2),StdDevDn(-2);
value1 = BollingerBand(Price,Length,StdDevUp);
value2 = BollingerBand(Price,Length,StdDevDn);
IF NewMarketParadigm(Price,Length,StdDevUp,StdDevDn) = 1 then begin
Plot1(value1,»»);
Plot2(value2,»»);
End;
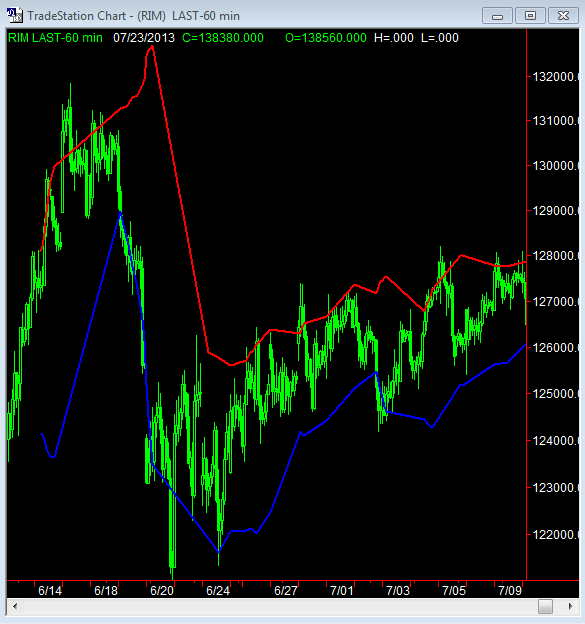
Type: Expansion Indicator, Name: NewMarketParadigm E, Style: RED
Input: Price(close),Length(28),StdDevUp(2),StdDevDn(-2);
value1 = BollingerBand(Price,Length,StdDevUp);
value2 = BollingerBand(Price,Length,StdDevDn);
IF NewMarketParadigm(Price,Length,StdDevUp,StdDevDn) = 2 then begin
Plot1(value1,»»);
Plot2(value2,»»);
End;