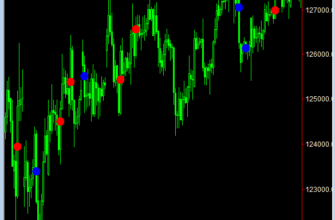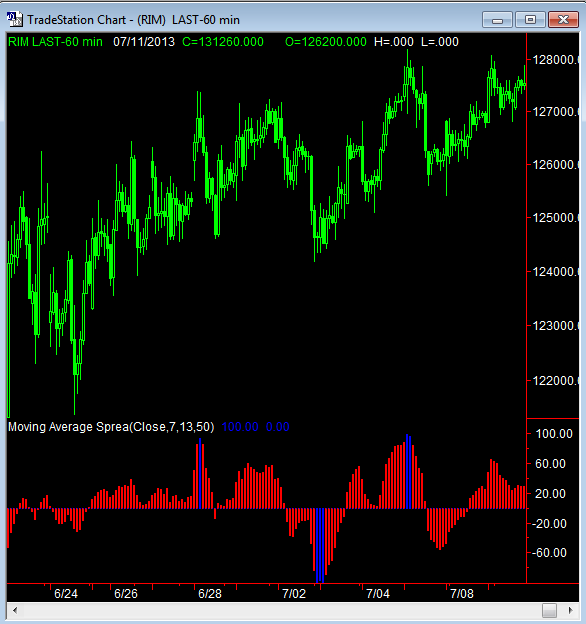
Type : Indicator, Name : Moving Average Spread Indicator
{MA Spread Indicator
Plots the difference between a short and long EMA as a percentage of
the maximum difference see over the last LookbackLen bars
ghkramer 10Jan05}
input: Price(Close), ShortMALen(7), LongMALen(13), LookbackLen(50);
var: Sema(0), Lema(0), dema(0), Maxd(0), Spread(0);
Sema = xAverage(Price, ShortMALen);
Lema = xAverage(Price, LongMALen);
dema = Sema — Lema;
MaxD = Highest(AbsValue(dema),LookbackLen);
if (MaxD > 0) then
Spread = 100*(dema/MaxD);
plot1(Spread, «Spread»);
plot2(0, «Zero»);
if Spread > 90 or Spread < -90 then
setplotcolor(1, Blue)
else
setplotcolor(1, Red);
if Spread >= 90 then begin
if barStatus(1) = 2 then
alert(GetSymbolname + » Spread at High Extreme»);
end;
if Spread <= -90 then begin
if barStatus(1) = 2 then
alert(GetSymbolname + » Spread at Low Extreme»);
end;