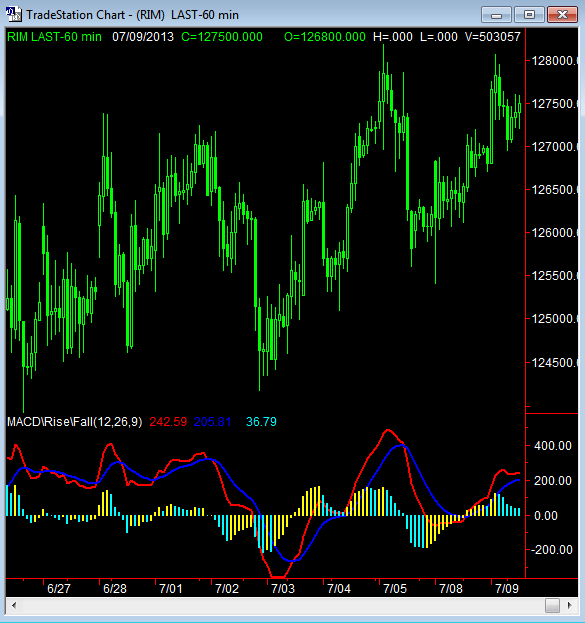
Type : Indicator, Name : MACD\Rise\Fall
{indicator MACD\Rise\Fall same results as TS MACD
with variation— colour changes in Histogram}
Input: FastMA(12),SlowMA(26),MacdMA(9);
Plot1(MACD(Close,FastMA,SlowMA),»MACD»);
Plot2(XAverage(MACD(Close,FastMA,SlowMA),MacdMA),»MACDAvg»);
Value1 = (Plot1-Plot2);
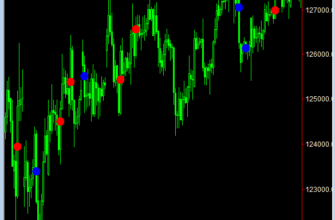
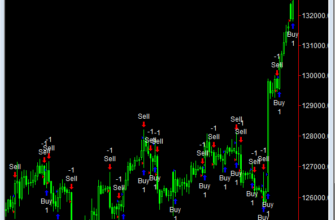
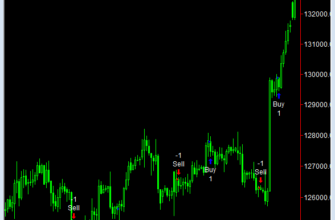
If Value1 > Value1[1] then Plot3(Value1,»MAup»){ Blue Histogram}
Else Plot4(Value1,»MAdn»); {Red Historgram}