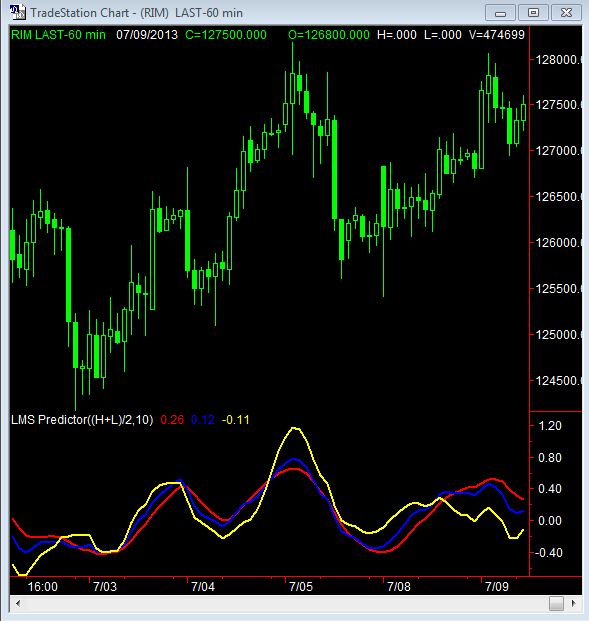
Type: Indicator, Name : LMS Predictor
Inputs: Price((H+L)/2),
Length(10);
Vars: SigPower(0),
Mu(0),
XBar(0),
count(0),
count1(0);
Arrays: G[30](0),
SigPredict[30](0);
{To be used as counter trend indicator
Value1 = .25*(Price + .5*(Price — Price[4])) + .75*Value1[1];
}
{To be used as a cycle mode indicator}
Value1 = .2*(2*(SlowK(Length) / 100 — .5)) + .8*Value1[1];
{Compute average power for normalization}
SigPower = 0;
For count = 0 to Length — 1 begin
SigPower = SigPower + Value1[count]*Value1[count];
end;
SigPower =SigPower / Length;
{Convergence Factor}
if SigPower > 0 then Mu = .25 / (SigPower*Length);
If CurrentBar > Length then begin
XBar = 0;
{Compute signal estimate}
For count = 1 to Length begin
XBar = XBar + Value1[count]*G[count];
end;
{Compute gain coefficients}
For count = 1 to Length begin
G[count] = G[count] + Mu*(Value1 — XBar)*Value1[count];
end;
{Compute signal prediction waveform}
For count = 0 to Length begin
SigPredict[count] = Value1[Length — count];
end;
{Extend signal prediction into the future}
For count = Length + 1 to Length + 5 begin
SigPredict[count] = 0;
For count1 = 1 to Length begin
SigPredict[count] = SigPredict[count] + SigPredict[count — count1]*G[count1];
end;
end;
Value2 = SigPredict[Length + 2];
Value3 = SigPredict[Length + 5];
Plot1(Value1, «SlowK»);
Plot2(Value2, «2Bar»);
Plot3(Value3, «5Bar»);
end;