Type: Function, Name: TXAverage
{TXAverage function
FORMAT: TXAverage(Price,r,s,u) }
Inputs: Price(NumericSeries), r(NumericSimple),s(NumericSimple),
u(NumericSimple);
TXAverage = XAverage(XAverage(XAverage(Price,r),s),u) ;
Type: Function, Name: TSI
{TSI function = True Strength Index by Bill Blau}
{FORMAT: TSI(Price,r,s,u)
Where: r = length of first EMA smoothing of 1 day momentum,
s = length of second EMA smoothing of 1 day smooting,
u = length of third EMA smooting of 1 daymomentum.}
Inputs:
Price(NumericSeries), r(NumericSimple), s(NumericSimple),
u(NumericSimple);
Value1= 100*TXAverage(Price-Price[1],r,s,u) ; { Numerator }
Value2=TXAverage(AbsValue(Price-Price[1]),r,s,u) ; { Denominator }
If Value2 <> 0 then TSI = Value1 / Value2
Else TSI = 0;
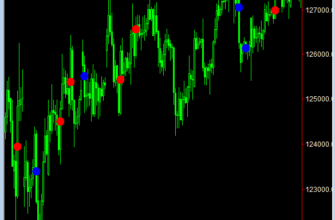
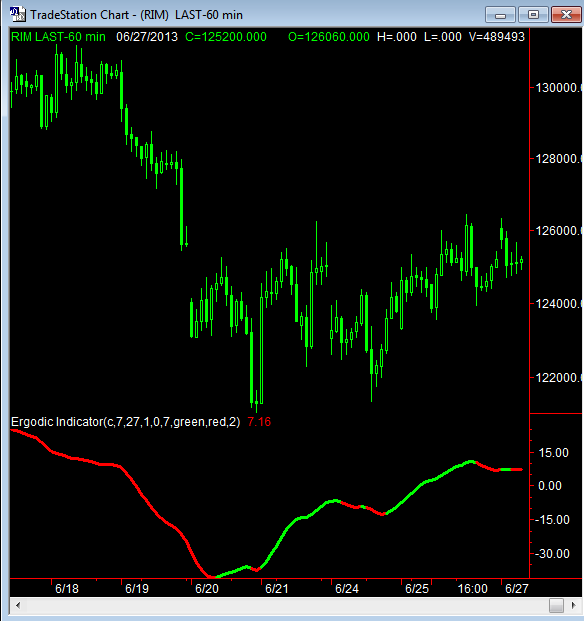
Type: Indicator, Name: Ergodic Indicator
{Ergodic Indicator:}
{from William Blau’s book — «Momentum, Direction and Divergence»
FORMAT: Ergodic_TSI(Price, r, s, u,, SmthLen)
where r = length of first EMA smoothing of 1 day momentum,
s = length of second EMA smoothing of 1 day smooting,
u = length of third EMA smooting of 1 daymomentum,
SmthLen = length of ema signal line.
This is plotting the Average only (value2)}
Inputs: Price(c), r(7), s(27), u(1), Zeroline(0), SmthLen(7),
upcolor_1(green), downcolor_1(red), dotsize(2);
Value1= TSI(Price, r, s, u);
Value2= XAverage(TSI(Price, r, s, u), SmthLen);
If value2 > value2[1] then
Plot3(Value2, «SigLin», upcolor_1, default, dotsize);
If value2 < value2[1] then
Plot3(Value2, «SigLin», downcolor_1, default, dotsize);