Type : Function, Name : jtHMA
Inputs: price(NumericSeries), length(NumericSimple);
Vars: halvedLength(0), sqrRootLength(0);
{
Original equation is:
———————
waverage(2*waverage(close,period/2)-waverage(close,period), SquareRoot(Period)
Implementation below is more efficient with lengthy Weighted Moving Averages.
In addition, the length needs to be converted to an integer value after it is halved and
its square root is obtained in order for this to work with Weighted Moving Averaging
}
if ((ceiling(length / 2) — (length / 2)) <= 0.5) then
halvedLength = ceiling(length / 2)
else
halvedLength = floor(length / 2);
if ((ceiling(SquareRoot(length)) — SquareRoot(length)) <= 0.5) then
sqrRootLength = ceiling(SquareRoot(length))
else
sqrRootLength = floor(SquareRoot(length));
Value1 = 2 * WAverage(price, halvedLength);
Value2 = WAverage(price, length);
Value3 = WAverage((Value1 — Value2), sqrRootLength);
jtHMA = Value3;
Type : Indicator, Name : jtHMA
{price: the time series being smoothed, usually Close, High, etc,
but could be RSI(Close, 25) for example.
length: the length of the MA, pretty meaningless in the normal sense
of moving averages, as this quantity is heavily modified
in the code. You need to experiment, do not just use a setting
of 20 because that is what works for you with Simple Moving Averages.
zeroLine: if you are using this in an indicator pane, you might
want to display a centre line of some sort, ths allows
one to set its value
zeroVisible: boolean variable, determines whether the centre line
(zeroLine) is plotted.
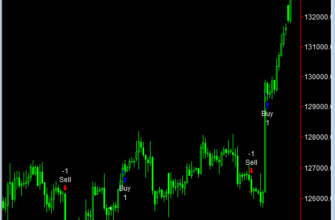
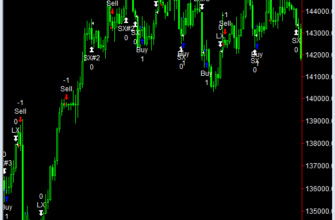
upColour: If you wish to differentiate upward movements by colour coding.
downColour: If you wish to differentiate downward movements by colour coding.
colourDeltaBar: Set this to 1 if you wish the colour change to be effective on
the actual bar where the direction change occurred.
Set this to 0 for default behaviour. All other values
are pretty meaningless.}
Inputs: price(Close), length(21),
zeroLine(0.0), zeroVisible(false),
upColour(Blue), downColour(Red), colourDeltaBar(1);
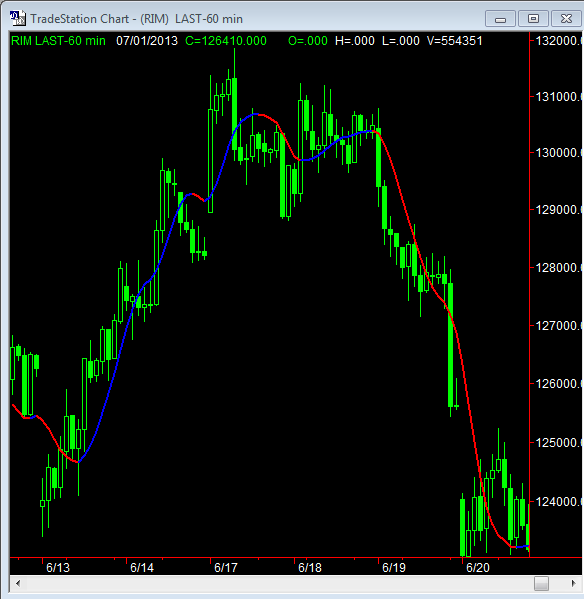
Value1 = jtHMA(price, length);
Plot1(Value1, «jtHMA»);
If ZeroVisible = true then
Plot2(zeroLine, «Zero»);
{ Color criteria }
if (Value1 > Value1[1]) then
SetPlotColor[colourDeltaBar](1, upColour)
else if (Value1 < Value1[1]) then
SetPlotColor[colourDeltaBar](1, downColour);