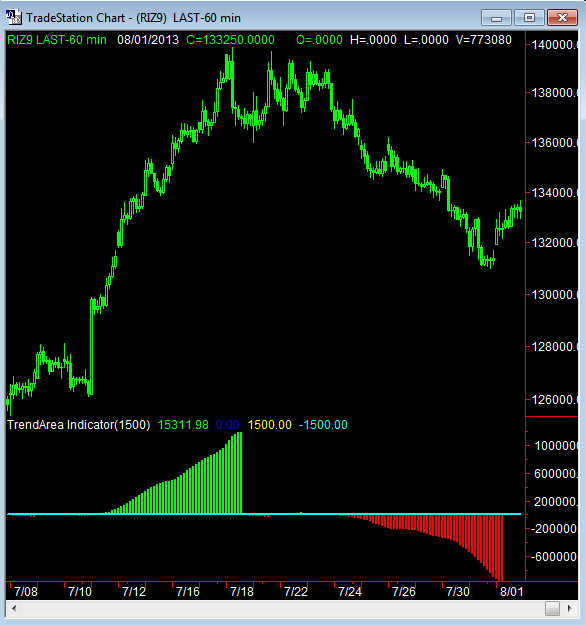
Type : Indicator, Name : TrendArea Indicator
inputs: ThresholdArea(1500);
vars: BarCount(0),SlowMA(0),FastMA(0),
color(0),area(0);
SlowMA = average(close,15);
FastMA = average(close,5);
{ see if we have a new possible trend starting }
if FastMA crosses above SlowMA or
FastMA crosses below SlowMA then
begin
BarCount = 0;
area = 0;
end;
{ increment BarCount +1 if FastMA above SlowMA…
decrement BarCount -1 if FastMA below SlowMA}
BarCount = IFF(FastMA > SlowMA,BarCount + 1,BarCount);
BarCount = IFF(FastMA < SlowMA,BarCount – 1,BarCount);
{ multiply each individual area by its barcount }
area = area + AbsValue(BarCount) * (FastMA – SlowMA);
color = IFF(BarCount > 0,green,cyan);
color = IFF(BarCount < 0,red,color);
plot1(area,”Area”,color);
plot2(0,”zero line”);
plot3(ThresholdArea,”+Thresh”);
plot4(-ThresholdArea,”-Thresh”);

