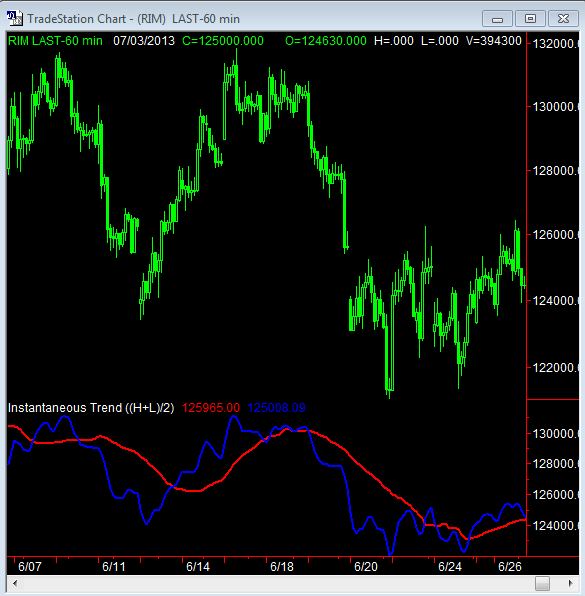
Typ: Indicatorn Name: Instantaneous Trend Line
Inputs: Price((H+L)/2);
Vars:
InPhase(0),
Quadrature(0),
Phase(0),
DeltaPhase(0),
count(0),
InstPeriod(0),
Period(0),
Trendline(0);
If CurrentBar > 5 then begin
{Compute InPhase and Quadrature components}
Value1 = Price – Price[6];
Value2 =Value1[3];
Value3 =.75*(Value1 – Value1[6]) + .25*(Value1[2] – Value1[4]);
InPhase = .33*Value2 + .67*InPhase[1];
Quadrature = .2*Value3 + .8*Quadrature[1];
{Use ArcTangent to compute the current phase}
If AbsValue(InPhase +InPhase[1]) > 0 then Phase =
ArcTangent(AbsValue((Quadrature+Quadrature[1]) / (InPhase+InPhase[1])));
{Resolve the ArcTangent ambiguity}
If InPhase < 0 and Quadrature > 0 then Phase = 180 – Phase;
If InPhase < 0 and Quadrature < 0 then Phase = 180 + Phase;
If InPhase > 0 and Quadrature < 0 then Phase = 360- Phase;
{Compute a differential phase, resolve phase wraparound, and limit delta phase errors}
DeltaPhase = Phase[1] – Phase;
If Phase[1] < 90 and Phase > 270 then DeltaPhase = 360 + Phase[1] – Phase;
If DeltaPhase < 1 then DeltaPhase = 1;
If DeltaPhase > 60 then Deltaphase = 60;
{Sum DeltaPhases to reach 360 degrees. The sum is the instantaneous period.}
InstPeriod = 0;
Value4 = 0;
For count = 0 to 40 begin
Value4 = Value4 + DeltaPhase[count];
If Value4 > 360 and InstPeriod = 0 then begin
InstPeriod = count;
end;
end;
{Resolve Instantaneous Period errors and smooth}
If InstPeriod = 0 then InstPeriod = InstPeriod[1];
Value5 = .25*(InstPeriod) + .75*Value5[1];
{Compute Trendline as simple average over the measured dominant cycle period}
Period = IntPortion(Value5); Trendline = 0;
For count = 0 to Period + 1 begin
Trendline = Trendline + Price[count];
end;
If Period > 0 then Trendline = Trendline / (Period + 2);
Value11 = .33*(Price + .5*(Price – Price[3])) + .67*Value11[1];
if CurrentBar < 26 then begin
Trendline = Price;
Value11 = Price;
end;
Plot1(Trendline, “TR”);
Plot2(Value11, “ZL”);
end;