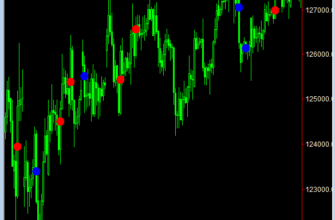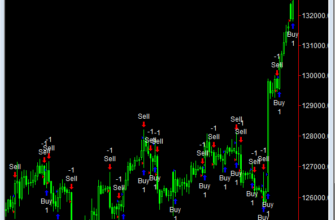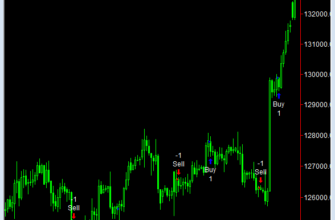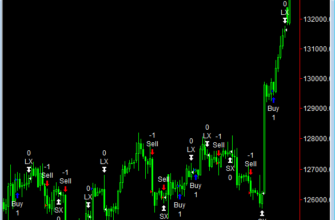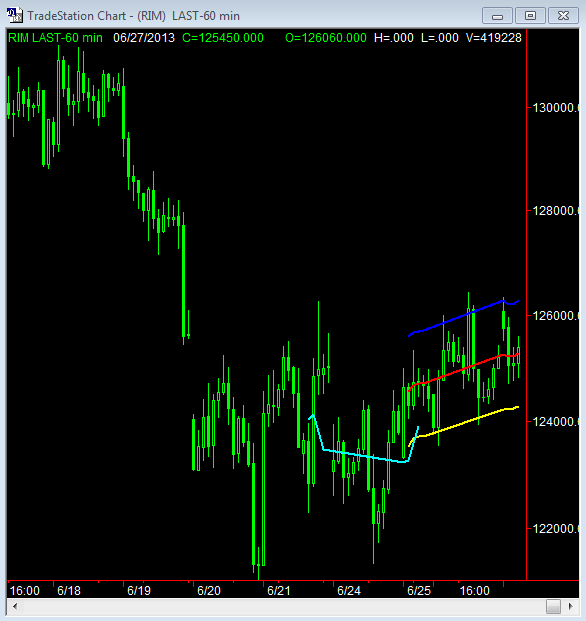
Type : Indicator, Name : Draw Linear Regression Lines For Two Past Periods
inputs : Periods(20);
vars : LRValueEnd(0),
LRSlopeEnd(0),
LRStdDevEnd(0),
LRValueBeg(0),
PlotBarsBack(0),
LRChanWidth(0);
LRValueEnd = LinearRegValue(close, Periods, 0);
LRSlopeEnd = LinearRegSlope(close, Periods);
LRStdDevEnd = stddev(close, Periods);
{
Print(file(“o:\omega\i_LRPrc.log”),Date, BarNumber, ” Close “, Close, “
LRVal “, LRValueEnd, ” LRSlp “, LRSlopeEnd, ” LRStd “, LRStdDevEnd);
}
if date = LastCalcDate then begin
{Plot end of last LR period)}
PlotBarsBack = 0;
LRChanWidth = (2 * LRStdDevEnd[PlotBarsBack]);
plot1[PlotBarsBack](LRValueEnd[PlotBarsBack],”LRP Short”);
plot2[PlotBarsBack]((LRValueEnd + LRChanWidth)[PlotBarsBack],”LRP S Upper”);
plot3[PlotBarsBack]((LRValueEnd – LRChanWidth)[PlotBarsBack],”LRP S Lower”);
{Plot begin of last LR period)}
LRValueBeg = LRValueEnd[PlotBarsBack] + ((Periods-1) *
(LRSlopeEnd[PlotBarsBack] * -1));
PlotBarsBack = Periods – 1;
plot1[PlotBarsBack](LRValueBeg, “LRP Short”);
plot2[PlotBarsBack]((LRValueBeg + LRChanWidth), “LRP S Upper”);
plot3[PlotBarsBack]((LRValueBeg – LRChanWidth), “LRP S Lower”);
{Plot end of prev LR period)}
plot4[Periods](LRValueEnd[Periods],”LRP S Prev”);
{Plot begin of last LR period)}
LRValueBeg = LRValueEnd[Periods] + ((Periods-1) *
(LRSlopeEnd[Periods] * -1));
PlotBarsBack = (Periods * 2) – 1;
plot4[PlotBarsBack](LRValueBeg, “LRP S Prev”);
end;

