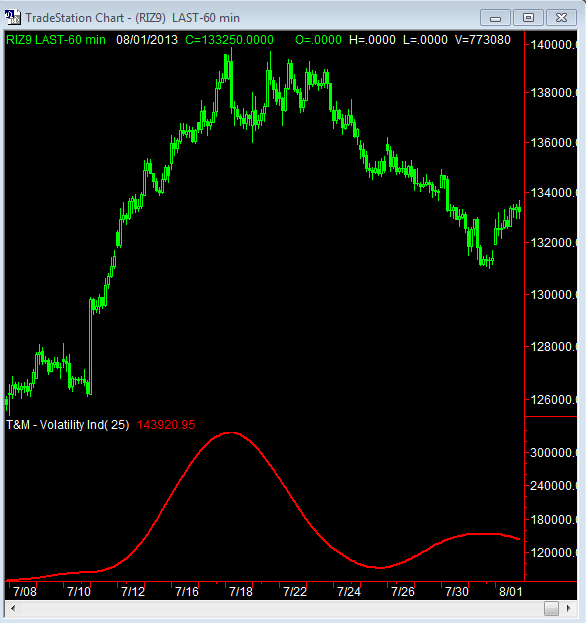
Type : Indicator, Name : T&M — Volatility Indicator
inputs:
Period( 25 ) ;
variables:
yom( 0 ),
avyom( 0 ),
varyyom( 0 ),
som( 0 ),
sigom( 0 ),
HalfPeriod( 0 ) ;
HalfPeriod = Period /2 ;
yom = 100 * (Close — Average( Close, Period ) /
Average( Close, Period ) );
avyom = Average( yom, 50 ) ;
varyyom = Average( yom*yom, 50 ) — ( avyom*avyom ) ;
som = squareroot( varyyom[ -HalfPeriod ] ) ;
sigom = Average( som, Period ) ;
plot1( sigom, «som» ) ;
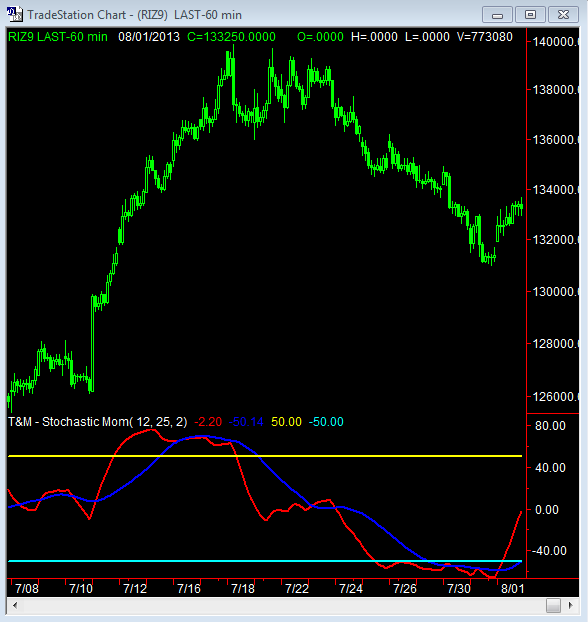
Type : Indicator, Name : T&M — Stochastic Momentum Indicator
inputs:
Length( 12),
Smooth1( 25 ),
Smooth2( 2 ) ;
value1 = 100 * ( XAverage( XAverage( Close — (.5 *
( Highest( High, Length ) + Lowest( Low, Length ) ) ),
Smooth1), Smooth2) /
(.5 * XAverage( XAverage( Highest( High, Length )-
Lowest( Low, Length ), Smooth1 ), Smooth2 ) ) ) ;
plot1( value1, «StochMom») ;
plot2( Average( value1, Smooth1 ), «SM Avg» ) ;
plot3( 50, «+50» ) ;
plot4( -50, «-50» ) ;
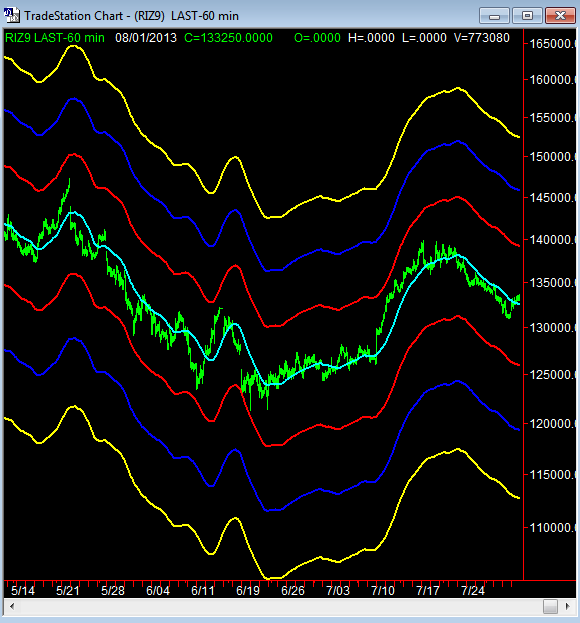
Type : Indicator, Name : T&M — ChanLinesHi Indicator
inputs:
Period( 25 ) ;
variables:
Arm( 0 ),
Level1( 0 ),
Level2( 0 ),
Level3( 0 ) ;
Arm = Average( C, Period ) ;
Level1 = (1 + (1.0 * 5/100 ) ) * Arm ;
Level2 = (1 + (2.0 * 5/100 ) ) * Arm ;
Level3 = (1 + (3.0 * 5/100 ) ) * Arm ;
plot1( Level1, «+L1» ) ;
plot2( Level2, «+L2» ) ;
plot3( Level3, «+L3» ) ;
plot4( Arm, «Arm» ) ;
Type : Indicator, Name : T&M — ChanLinesLo Indicator
inputs:
Period( 25 ) ;
variables:
Arm( 0 ),
Level1( 0 ),
Level2( 0 ),
Level3( 0 ) ;
Arm = Average( C, Period ) ;
Level1 = (1 — (1.0 * 5/100 ) ) * Arm ;
Level2 = (1 — (2.0 * 5/100 ) ) * Arm ;
Level3 = (1 — (3.0 * 5/100 ) ) * Arm ;
plot1( Level1, «-L1» ) ;
plot2( Level2, «-L2» ) ;
plot3( Level3, «-L3» ) ;
plot4( Arm, » Arm » ) ;